Quantitative
Performance Analysis
ACE V7 / XAUUSD / H1 Configuration Series
19 June 2012 - 26 October 2026
Executive summary
Six configurations of ACE V7, without range blocking, are examined over 770 closed positions each. They share the same execution and position-management rules; the configured difference is the progression of position size following the sequence of realized outcomes. Base executes a constant 0.05 lots per position. The capital-linked sizing layer does not activate in any of the six configurations.
The constant-size series already exhibits positive realized expectancy: a 35.45% win rate combines with an average gain approximately 2.74 times the average loss. The subsequent policies increase the economic weight of selected positions and joint exposure episodes; they do not create a higher signal hit rate.
| Config. | Net profit | Return on initial capital | Net PF | Max equity DD | Max DD, USD |
|---|---|---|---|---|---|
| Base | 29,135.55 | 291.36% | 1.5078 | 18.59% | 5,597.71 |
| C1 | 40,242.26 | 402.42% | 1.6176 | 18.99% | 6,539.22 |
| C2 | 63,804.56 | 638.05% | 1.7886 | 21.06% | 8,820.12 |
| C3 | 110,664.47 | 1,106.64% | 2.0775 | 21.61% | 14,761.49 |
| C4 | 198,221.15 | 1,982.21% | 2.4355 | 26.79% | 25,399.93 |
| C5 | 365,721.96 | 3,657.22% | 2.9427 | 36.92% | 44,503.76 |
Principal finding
From Base to C5, net profit increases 12.55 times. Maximum observed equity drawdown rises from 18.59% to 36.92%, while maximum monetary drawdown rises 7.95 times. This is a non-proportional change in realized profit and drawdown, accompanied by a substantial increase in exposure.
Base-C4 retain identical entry and exit times and execution prices. C5 matches 767 of the 770 position paths exactly; its execution differences are separated from sizing effects in the analysis. Configurations are identified as Base and C1-C5 throughout.
XAUUSD / H1. Initial capital: USD 10,000. Results net of recorded commissions and swaps. Drawdown is measured from observed account equity.
1. Capital trajectories and drawdown
The equity paths show the monetary expression of the six policies. A logarithmic scale preserves proportional comparisons across different capital levels. Drawdown panels use an identical percentage scale so that the larger final balances do not obscure interim declines.
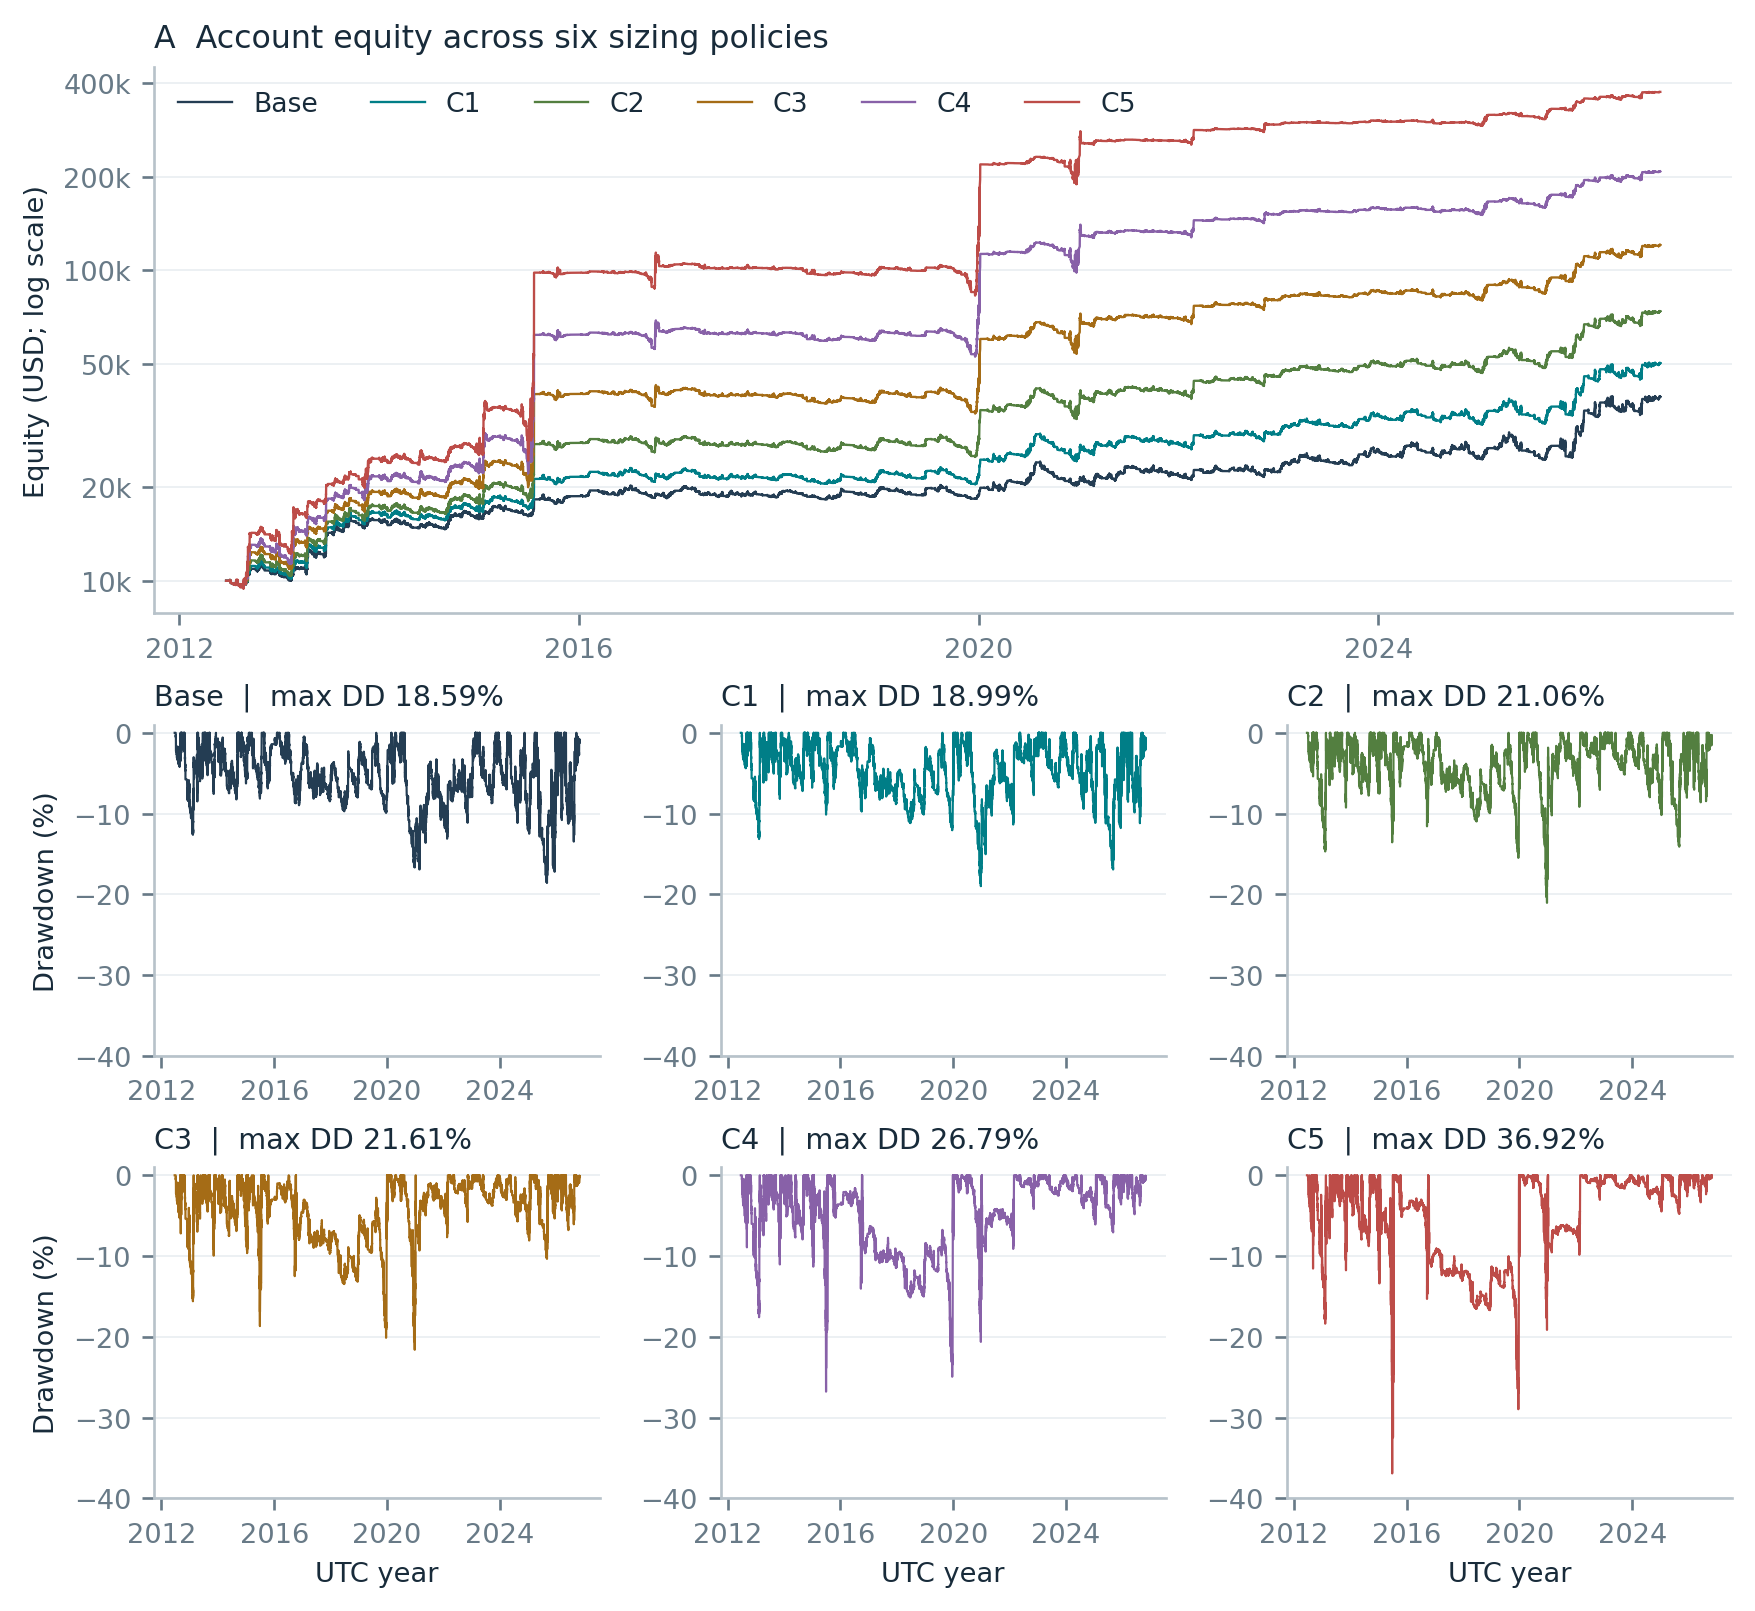
Figure 1. A: account equity, logarithmic USD scale. Lower panels: decline from the running observed equity peak, shown separately for each configuration with a common vertical range. Lines are deliberately thin; the panels preserve each drawdown path without six overlapping traces.
C5 ends at USD 375,721.96, versus USD 39,135.55 for Base. Percentage drawdown and monetary drawdown measure different aspects of the same path: a larger account can experience a higher dollar loss without a proportionate percentage decline. Neither measure is a bound on future loss.
2. Realized distribution and payoff asymmetry
Base records 273 net winners and 497 net losers. Its average winner is USD 316.91, compared with an average absolute loss of USD 115.45. The observed mean is therefore positive despite the lower frequency of winning positions.
E[P&L] = 0.35455 × 316.90736 - 0.64545 × 115.45304 = USD 37.84 per position.
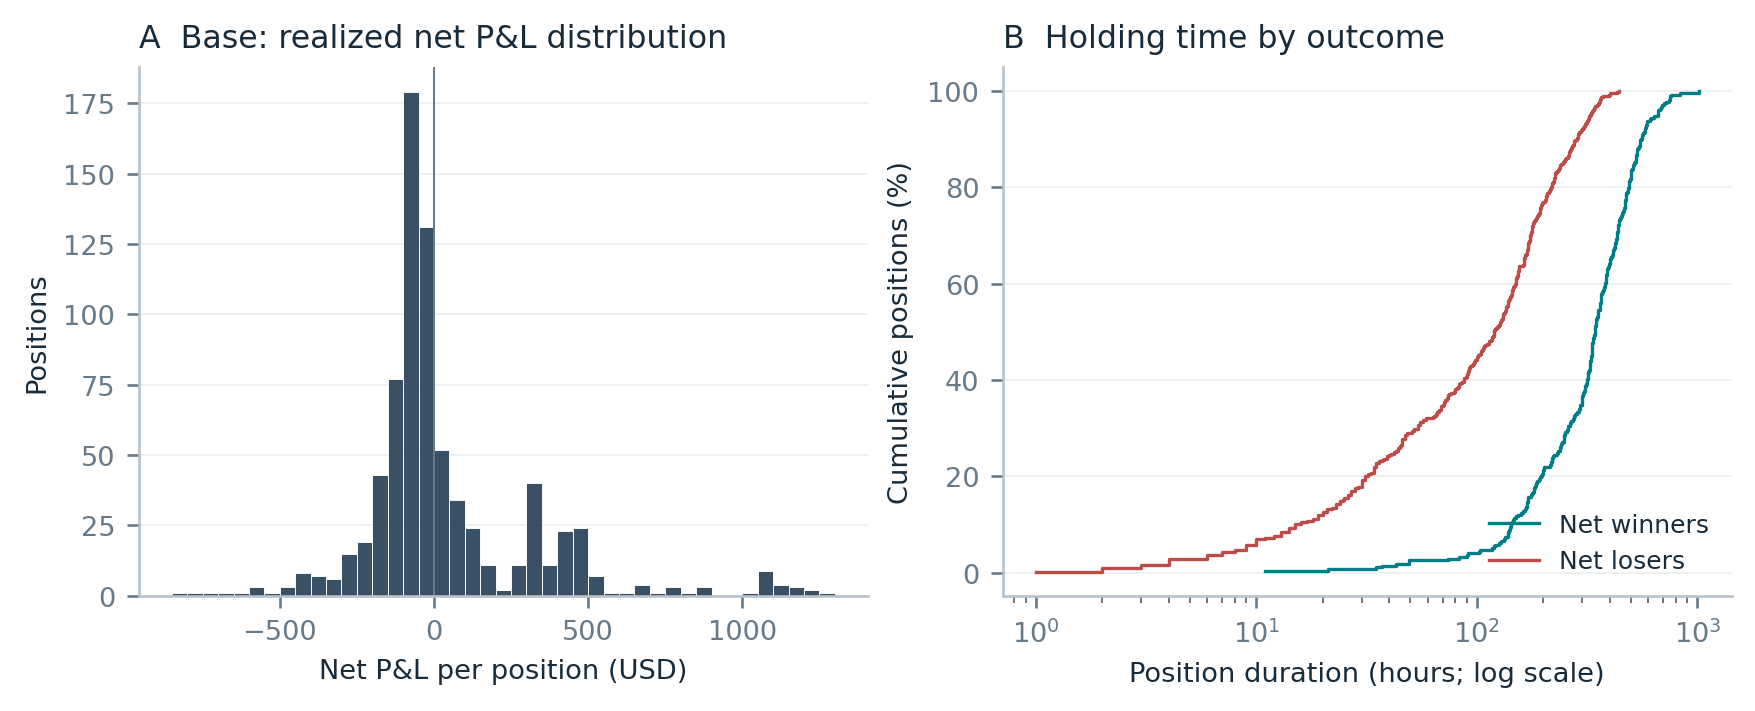
Figure 2. A: histogram of net position results at constant size. B: empirical cumulative holding-time distributions conditional on net outcome; the horizontal axis is logarithmic. The displayed expectancy is a sample mean, not an assumed probability model.
| Config. | Win rate | Mean gain | Mean loss¹ | Gain / loss | Mean P&L |
|---|---|---|---|---|---|
| Base | 35.45% | 316.91 | 115.45 | 2.745 | 37.84 |
| C1 | 35.45% | 386.08 | 131.10 | 2.945 | 52.26 |
| C2 | 35.45% | 530.08 | 162.79 | 3.256 | 82.86 |
| C3 | 35.45% | 781.57 | 206.65 | 3.782 | 143.72 |
| C4 | 35.32% | 1,236.43 | 277.29 | 4.459 | 257.43 |
| C5 | 35.32% | 2,036.66 | 378.01 | 5.388 | 474.96 |
¹ Absolute magnitude of the mean net loss. All position amounts are USD.
Base winners remain open for 352.42 hours on average, against 131.84 hours for losers. The asymmetry is expressed jointly through outcome magnitude and holding time. Progression changes the monetary distribution: C5's gain/loss ratio reaches 5.39, while its win rate remains approximately 35%.
C4 and C5 each have one fewer net winner than Base. The affected position changes from +USD 0.03 to -USD 0.09 after costs; its direction, entry and exit are unchanged. This is a near-zero net classification effect, not a loss of the underlying price move.
3. Directional contribution and closing mechanisms
Both trade directions contribute positively in every configuration, but their contributions are unequal. Bidirectional execution therefore describes participation in both rising and falling price paths; it does not imply equal directional performance or simultaneous hedging.
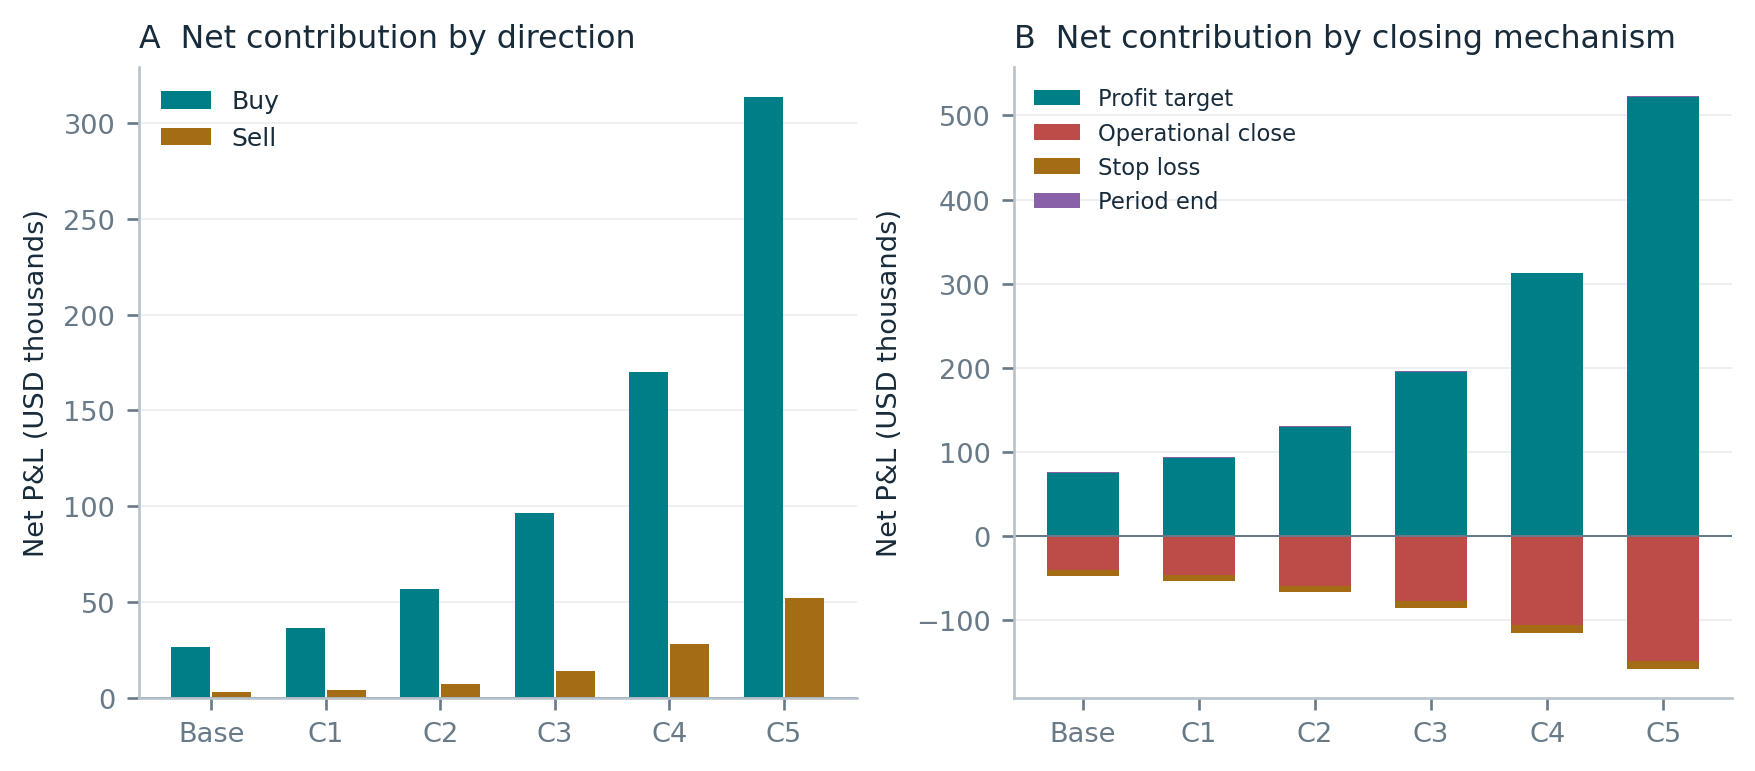
Figure 3. A: net contribution of buys and sells. B: signed contribution by closing mechanism. Positive and negative components are shown separately; the bars do not represent gross trading volume.
| Config. | Buy net | Buy PF | Sell net | Sell PF |
|---|---|---|---|---|
| Base | 26,382.18 | 1.950 | 2,753.37 | 1.093 |
| C1 | 36,395.14 | 2.162 | 3,847.12 | 1.114 |
| C2 | 56,589.58 | 2.444 | 7,214.98 | 1.173 |
| C3 | 96,543.15 | 2.951 | 14,121.32 | 1.265 |
| C4 | 170,100.30 | 3.568 | 28,120.85 | 1.391 |
| C5 | 313,692.92 | 4.502 | 52,029.04 | 1.527 |
How positions close
145 profit-target exits provide USD 75,596.05 in Base. 602 operational closes contribute -USD 40,373.04; these include 127 positive and 475 negative results. 22 stop-loss exits contribute -USD 6,714.12. One period-end close contributes +USD 626.66. These counts reconcile to all 770 positions.
The realized distribution is not determined by the initial protection and objective distances alone. Operational exits can close positions before the original stop is reached, while other positions remain active until their profit objective. The net result is the combined effect of entry selection and subsequent management, rather than a mechanically symmetric stop/target payoff.
A stop-loss classification includes execution at an active stop; it does not by itself identify the incremental contribution of a trailing adjustment.
4. Joint positions and aggregate exposure
The positions form 340 continuous exposure episodes and originate from 421 entry contexts. There are 714 overlapping position pairs, including 241 pairs from different entry contexts. No opposite-direction overlap is observed. The result must therefore also be read at the level of concurrent positions and successive contexts.
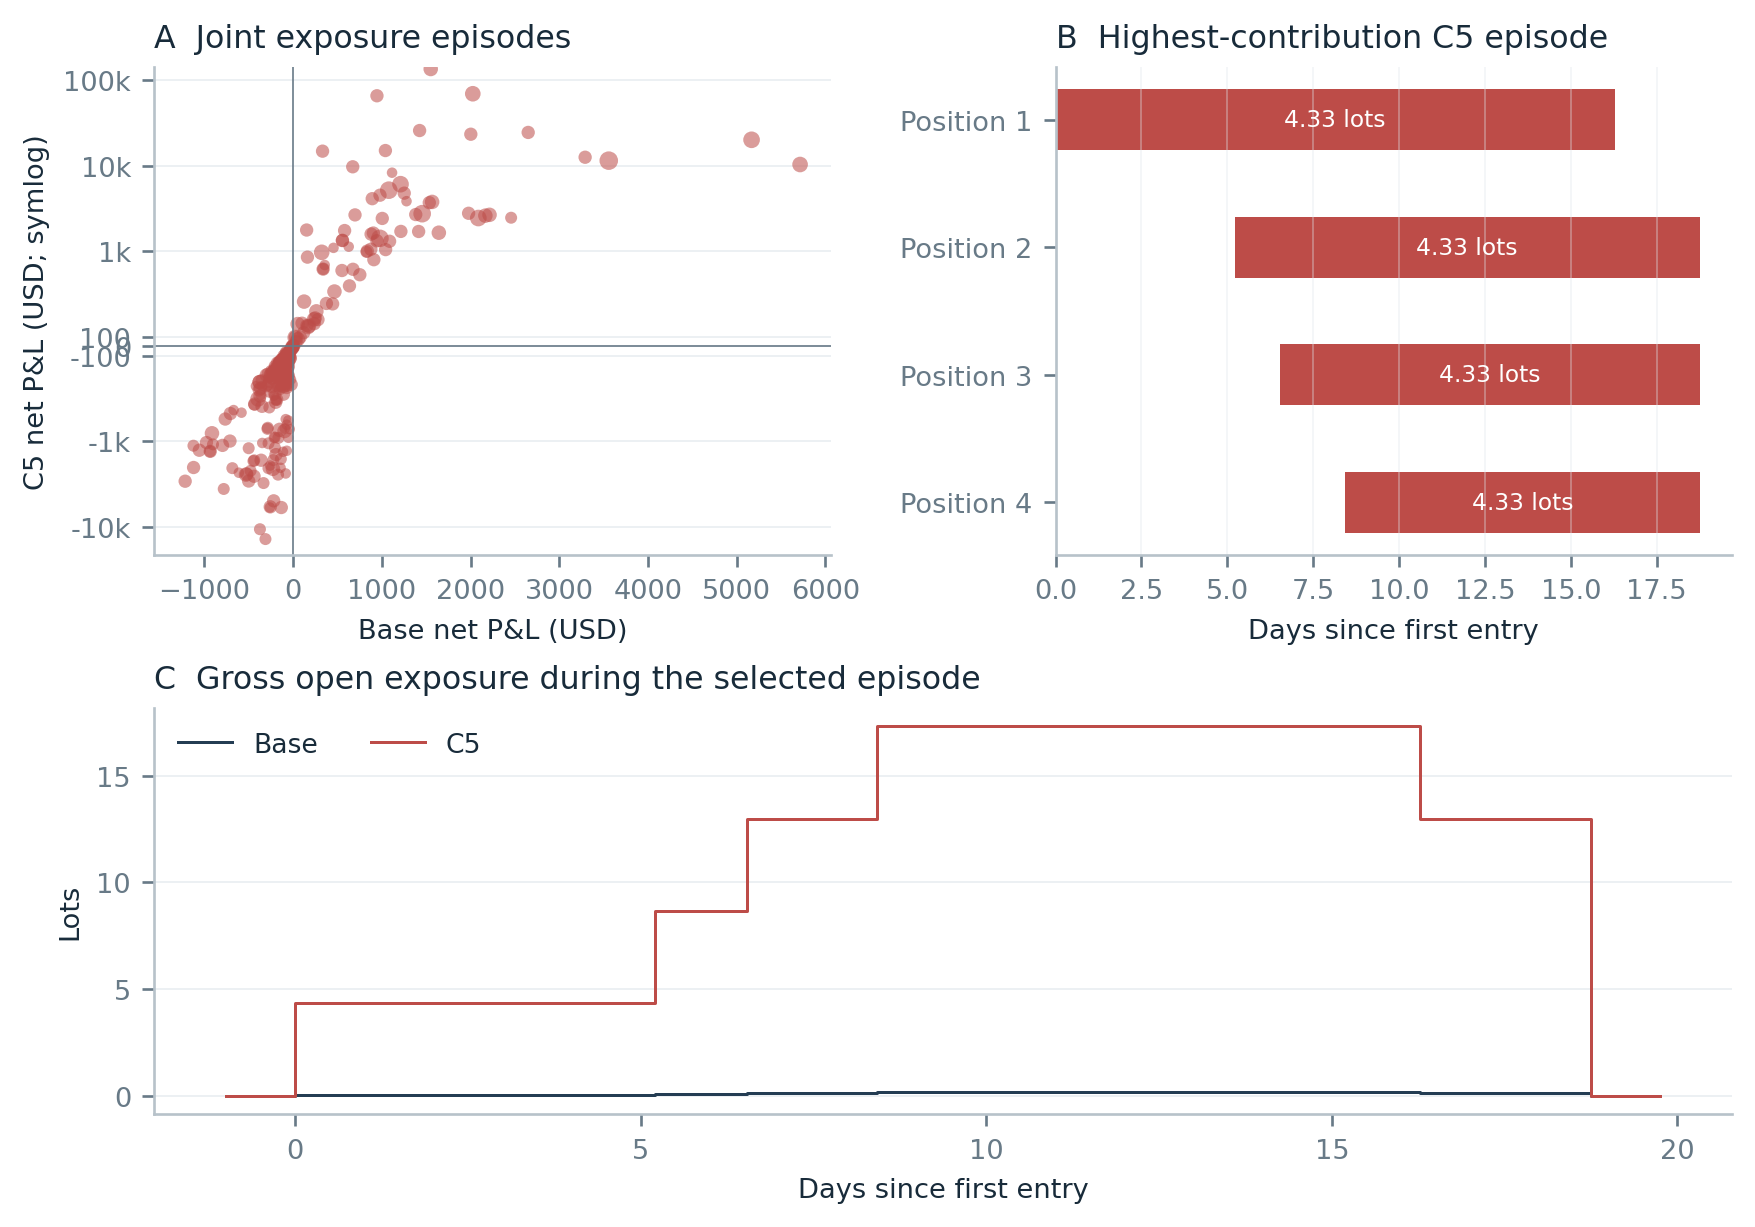
Figure 4. A: net results of corresponding exposure episodes; marker area increases with position count. The C5 axis uses a symmetric logarithmic scale with a linear region around zero. B-C: the highest-contribution C5 episode, 18 December 2019 - 5 January 2020; positions retain their size until exit.
| Exposure measure | Base | C5 |
|---|---|---|
| Maximum concurrent positions | 5 | 5 |
| Peak gross lots | 0.25 | 17.32 |
| Time-weighted mean gross lots | 0.0643 | 0.3255 |
| Time with any open position | 61.21% | 61.21% |
The illustrated episode contains four buys of 4.33 lots each. Their closes produce USD 134,327.30 in C5. A winning close changes the progression state for subsequent entries; it does not resize the positions already open. Large positions can therefore coexist after the sizing state has reset.
Exposure averages are integrated over elapsed clock time between openings and closings. They describe the actual duration of concurrent exposure, not an unweighted average of trade sizes.
5. Position matching and economic normalization
The configurations are compared position by position. Base-C4 have identical directions, entry and exit timestamps, and entry and closing prices for all 770 positions. This provides a direct basis for separating common price paths from their monetary weights.
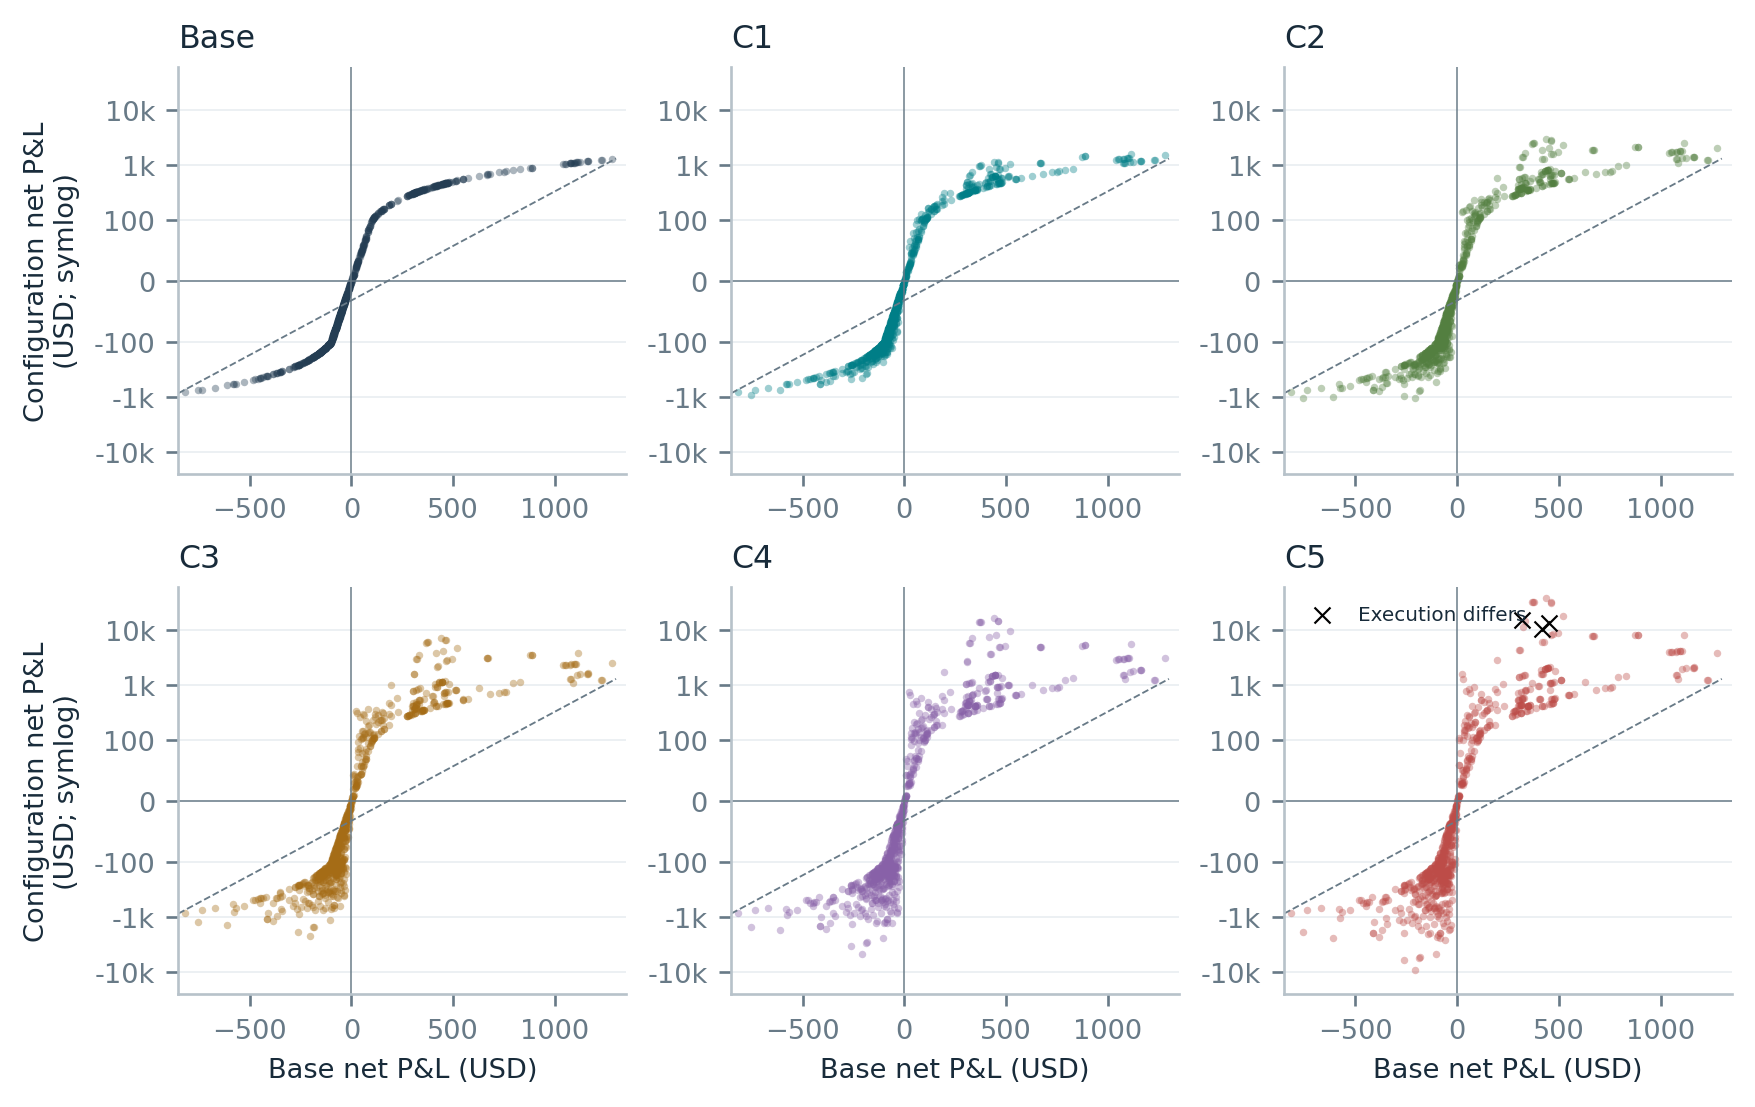
Figure 5. Each point pairs a position with its Base counterpart. Dashed lines indicate equal net P&L. The vertical axes share a symmetric logarithmic scale, with a linear region of ±USD 100. Small, transparent markers preserve dense regions; black crosses identify the three C5 positions with different execution paths.
| Normalization to 0.05 lots | Base | C1 | C2 | C3 | C4 | C5 |
|---|---|---|---|---|---|---|
| Net closed P&L, USD | 29,135.55 | 29,125.02 | 29,122.56 | 29,125.49 | 29,122.52 | 29,047.47 |
Each realized net result is divided by its size relative to Base. The near-coincidence of the normalized totals is consistent with common execution paths. This is an arithmetic normalization of executed results, not a risk adjustment or an independently executed constant-size counterfactual.
C5 has two rejected opening attempts due to insufficient margin. One sell opens later at a different price. Two other sells exchange closing times and prices relative to their Base counterparts. The remaining 767 paths match exactly. Consequently, C5 cannot be described as a pure rescaling of an entirely identical execution history.
Commissions and swaps do not scale perfectly at the smallest monetary increments. Their normalization differences are retained in the arithmetic rather than attributed to a change in the signal.
6. Sequential sizing and result attribution
Position size depends on the progression state when an entry is admitted. It is not a fixed multiplier of the complete equity curve. The sequence of closes determines future weights, while each open position keeps its originally executed volume.
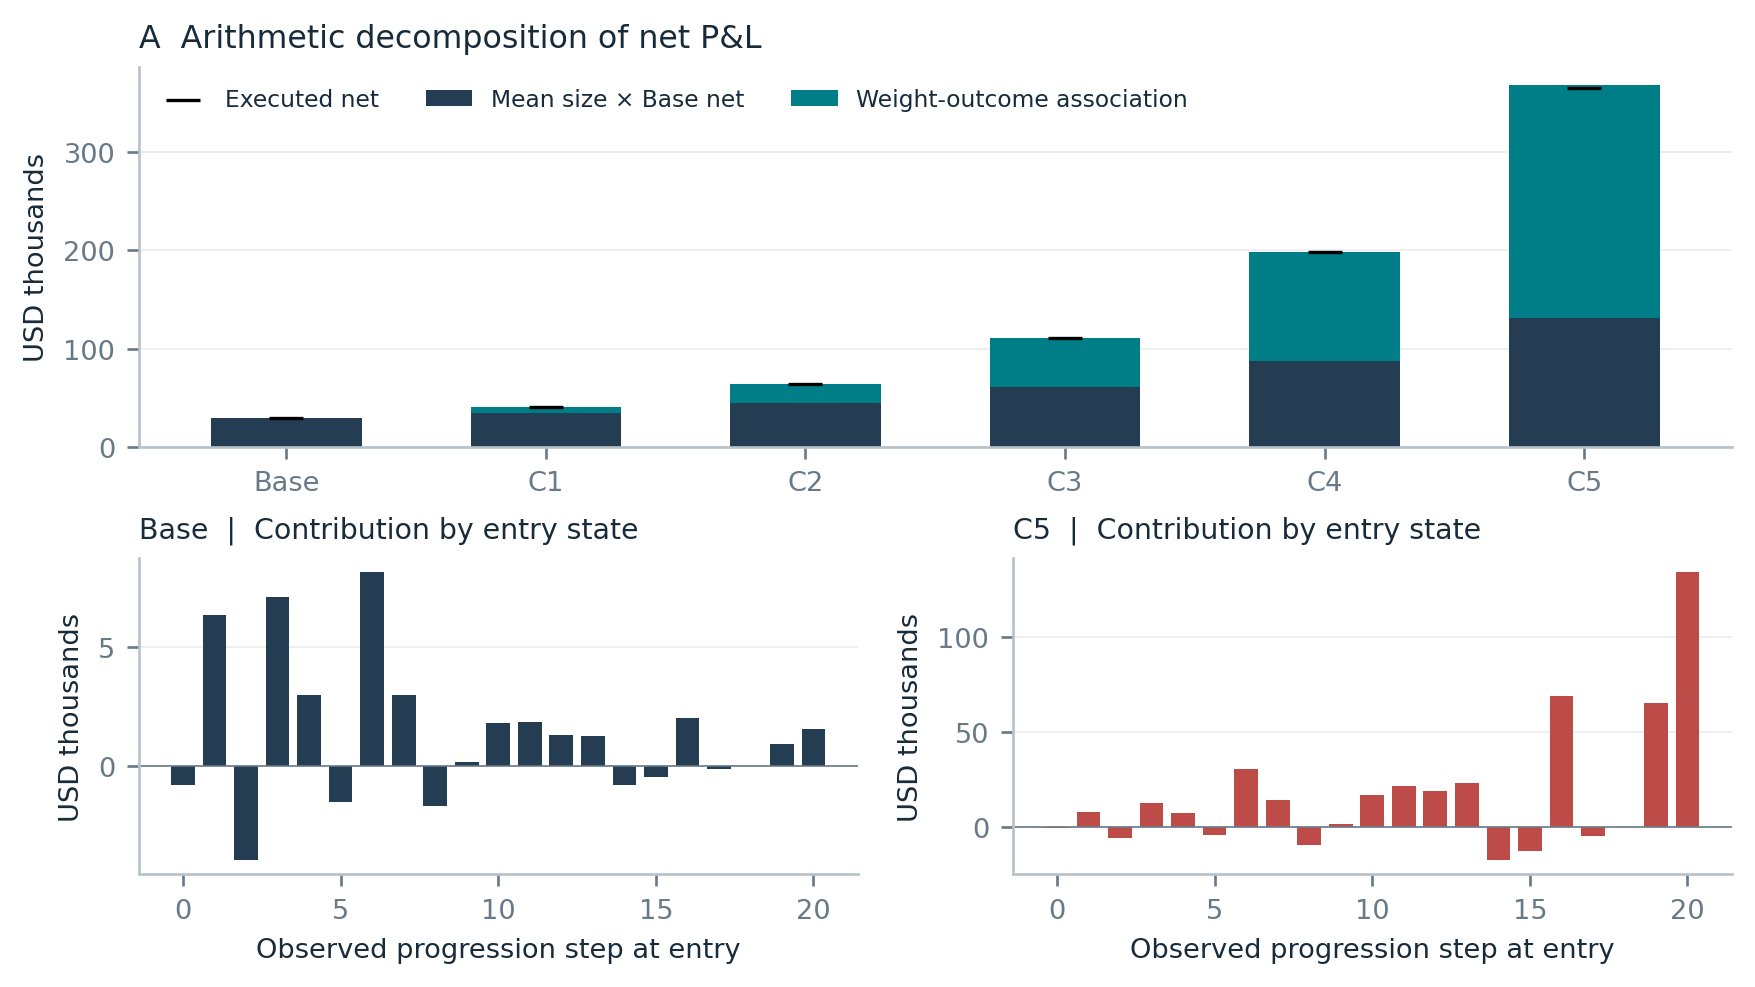
Figure 6. A: separation of average-size scaling and the association between position weights and Base outcomes; black markers show the executed total. B: contributions by progression step at entry, shown separately for Base and C5. Steps are observed execution states, not independent strategies.
Let xi be Base net P&L, wi the executed size relative to Base and yi the configuration result. The exact sample identity is:
Σyi = mean(w) × Σxi + N × Cov(w,x) + Σ(yi - wixi).
| Config. | Mean weight | Mean-size component | Association component | Residual¹ |
|---|---|---|---|---|
| Base | 1.000 | 29,135.55 | 0.00 | 0.00 |
| C1 | 1.174 | 34,205.89 | 6,050.06 | -13.69 |
| C2 | 1.526 | 44,460.09 | 19,364.68 | -20.22 |
| C3 | 2.072 | 60,359.78 | 50,326.93 | -22.24 |
| C4 | 3.007 | 87,618.54 | 110,641.56 | -38.96 |
| C5 | 4.511 | 131,435.39 | 237,034.33 | -2,747.76 |
¹ Executed P&L less the weighted Base reference; population covariance uses denominator N.
For C5, mean-size scaling accounts for USD 131,435.39, while the observed weight-outcome association adds USD 237,034.33. The residual is USD -2,747.76: USD -2,704.56 from gross execution differences and USD -43.20 from costs.
C5 net winners carry 5.94 times Base size on average, against 3.73 for net losers. The positive association is an ex-post property of this sequence, not evidence that future winners are known when volume is assigned.
7. Temporal contribution and concentration
The full-period result is unevenly distributed across calendar years and exposure episodes. Closed-position contribution is assigned to the year of exit; it differs from annual marked-to-market equity returns when positions span year-end.
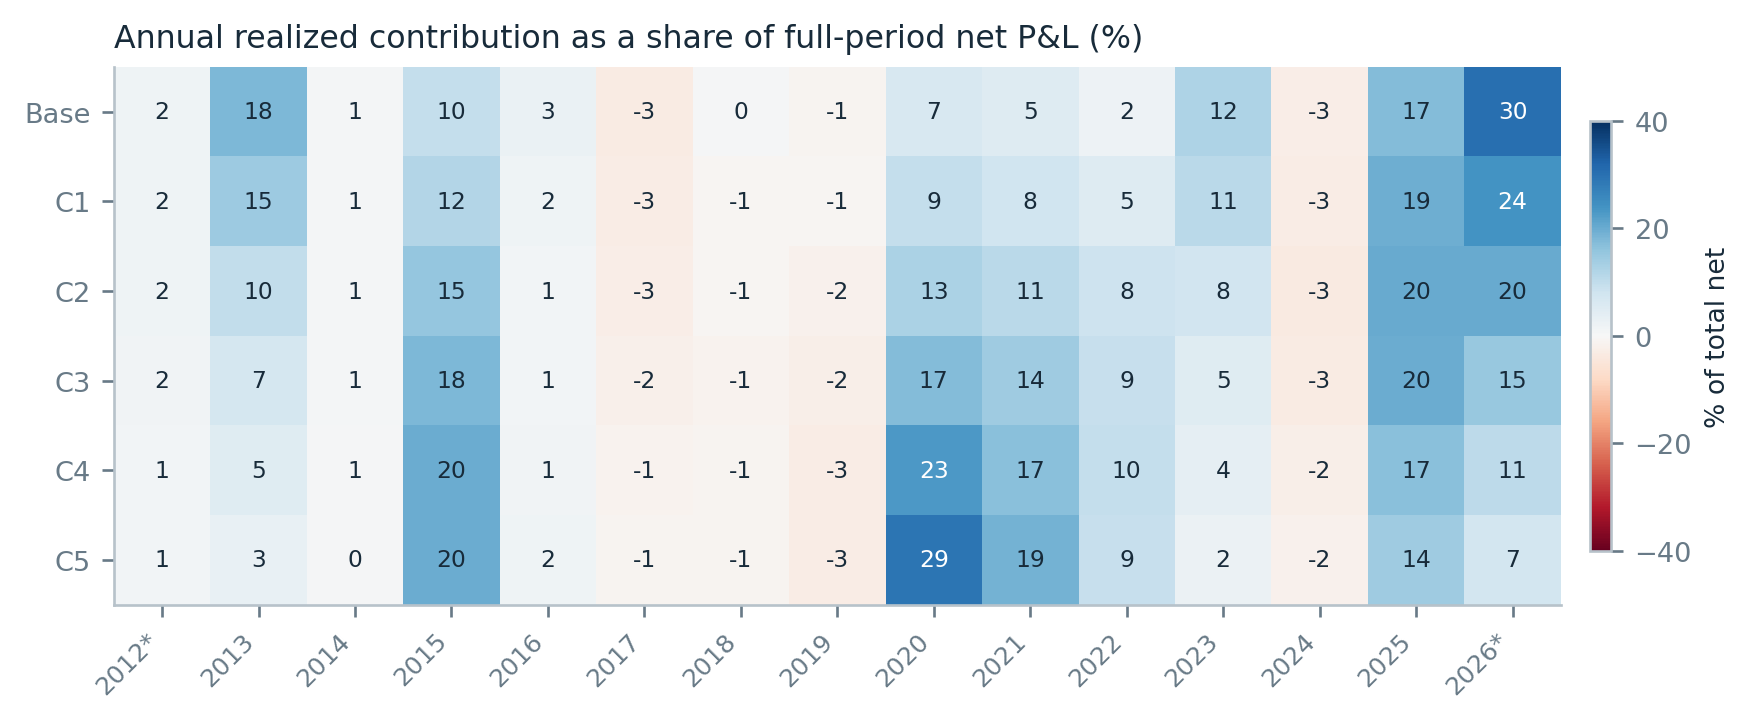
Figure 7. Annual realized net P&L divided by each configuration's full-period net P&L. A cell of 29 means that year contributes 29% of the full-period net, not a 29% annual return. Asterisks mark incomplete calendar years, 2012 and 2026.
| Config. | Top 10 episodes: net USD | Share of total net | Other episodes: net USD |
|---|---|---|---|
| Base | 31,338.22 | 107.56% | -2,202.67 |
| C1 | 40,876.91 | 101.58% | -634.65 |
| C2 | 67,410.15 | 105.65% | -3,605.59 |
| C3 | 119,366.45 | 107.86% | -8,701.98 |
| C4 | 214,625.40 | 108.28% | -16,404.25 |
| C5 | 404,227.11 | 110.53% | -38,505.15 |
The ten largest profitable episodes contribute more than 100% of net profit in every configuration. The remaining episodes are negative in aggregate. This concentration is consistent with a payoff profile in which relatively infrequent favorable sequences compensate for many smaller losses; it is material to understanding the result.
In C5, the 20 positions entered at progression steps 16 and above contribute USD 263,676.92, or 72.10% of full-period net profit. The largest single episode contributes 36.73%. These figures describe where realized profit accumulated, without treating overlapping positions as independent observations.
Drawdown also increases in absolute terms. Peak gross open size grows from 0.25 lots to 17.32 lots. A rising profit factor or a favorable net-profit/drawdown comparison must therefore be interpreted alongside exposure and concentration, rather than as unchanged risk.
8. Operational interpretation and measurement
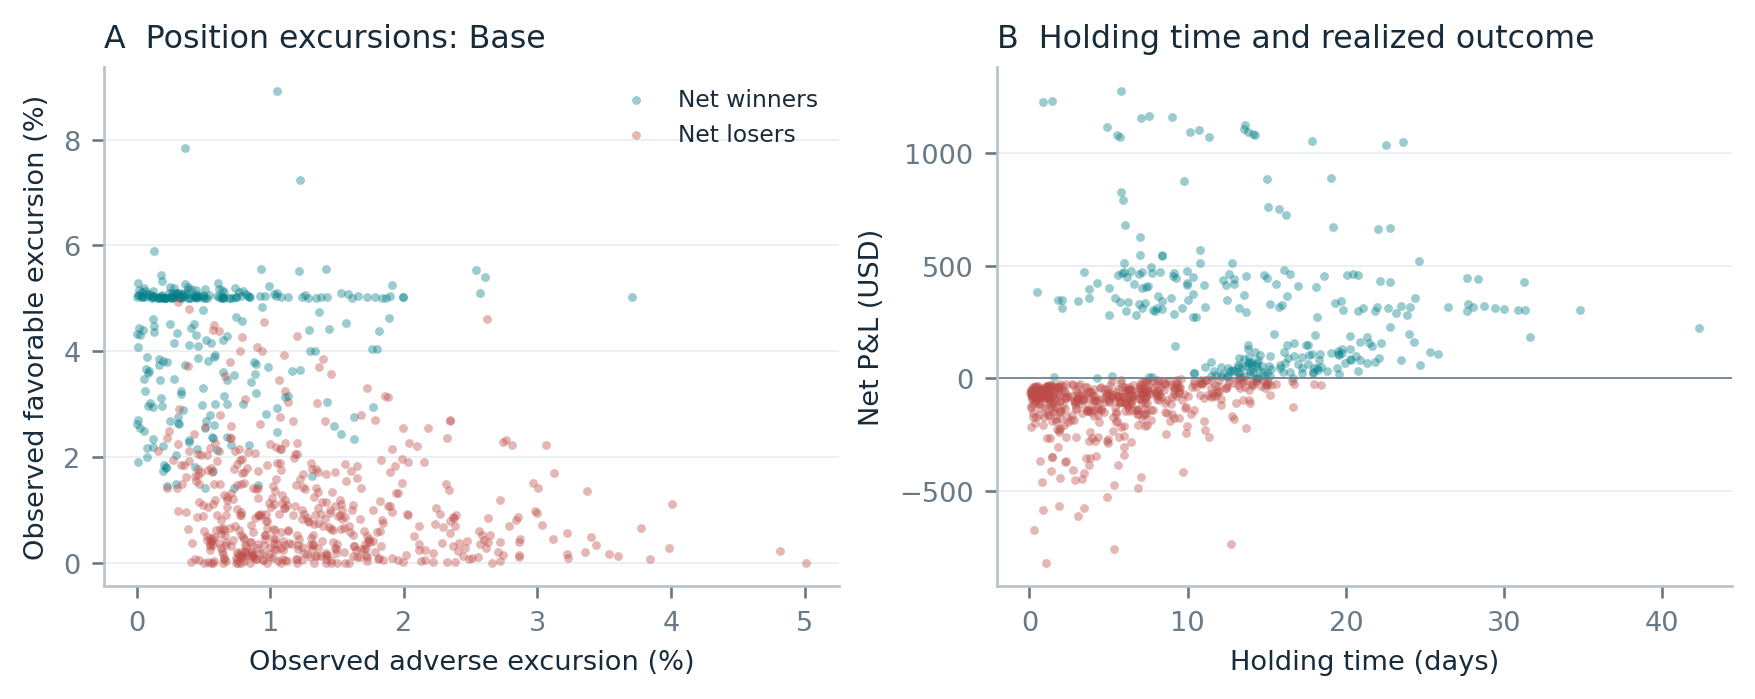
Figure 8. A: maximum observed favorable and adverse price excursions, expressed as percentages of entry price, for the 769 positions with complete lifecycle measurements. B: holding time versus net P&L for all 770 closed positions. Excursions use side-appropriate exit quotes and the closing fill.
What the series demonstrates
Execution and position management: the constant-size result is generated by a coordinated sequence of entries, operational exits, protective stops and profit objectives. Positive expectancy is already present before sequential size progression. The observations document the combined process; they do not isolate an entry signal as the sole source of the result.
Asymmetric realized payoffs: gains occur less frequently than losses, but their mean magnitude and holding time are larger. The sizing policies amplify selected joint episodes and increase the observed gain/loss ratio. This is empirical payoff asymmetry; no formal option-like convexity property is assumed.
Capital and execution: the capital-linked base-lot layer remains inactive throughout these runs. The increased results arise through sequential sizing and its interaction with the realized paths. C5 additionally exhibits margin-related admission failures and a small set of execution differences, which are retained in its result.
Measurement definitions
Net profit: sum of all 770 closed-position results, reconciled to final balance less USD 10,000. One period-end position is included in every configuration. Net profit factor: sum of positive net results divided by the absolute sum of negative net results. Gain/loss ratio: mean positive net result divided by mean absolute negative net result.
Equity drawdown: decline from a running observed account-equity peak. Maximum percentage and dollar drawdown are computed over the complete observed path and need not occur in the same episode. Exposure episode: a continuous interval with at least one tracked position open. Pair overlap counts measure coexistence and are not independent trades.
Scope: descriptive quantitative analysis of the selected configuration series. No indicator definitions, signal thresholds or proprietary admission formulas are disclosed. Recorded outcomes and accounting identities are distinguished from causal attribution and future performance.
XAUUSD / H1 / 19 June 2012 - 26 October 2026. Initial capital: USD 10,000. Results net of recorded commissions and swaps.